The Venn diagram – invented in 1880 by philosopher and mathematician John Venn – is the standard in visual argumentation for everyone from third graders to C-suite executives. A picture may be worth a thousand words, but a good Venn diagram can be a whole damn thesis.
With that in mind, Plan B wanted to take the Venn diagrams advertising firms have learned to love so well and flip them back on ourselves. If Venn diagrams are meant to illustrate the relationships between disparate concepts, what might a group of seasoned marketing professionals armed with pencil, paper, and some circles reveal about the insanity that is our industry? Let’s find out.
First step, brainstorming the diagrams.
The vast majority of Venn diagrams use fairly standard concepts. Demographics, genres, media segments, etc. are all common circles you might see in your average marketing Venn. Plan B wanted something a little different. Our team looked outside your average Venn diagrams to speak to how we view marketing. Not just through numbers and data, but through opinions and experience.
How can you illustrate tight deadlines? The creative process? Or the current advertising landscape? Those were among the questions we asked ourselves. Over the course of several weeks, our team created dozens of Venn diagrams, all wildly different. Each diagram came from our personal journey through this industry.
They were creative, but more importantly, were they funny? That’s what we needed to find out.
Next step, pressure testing.
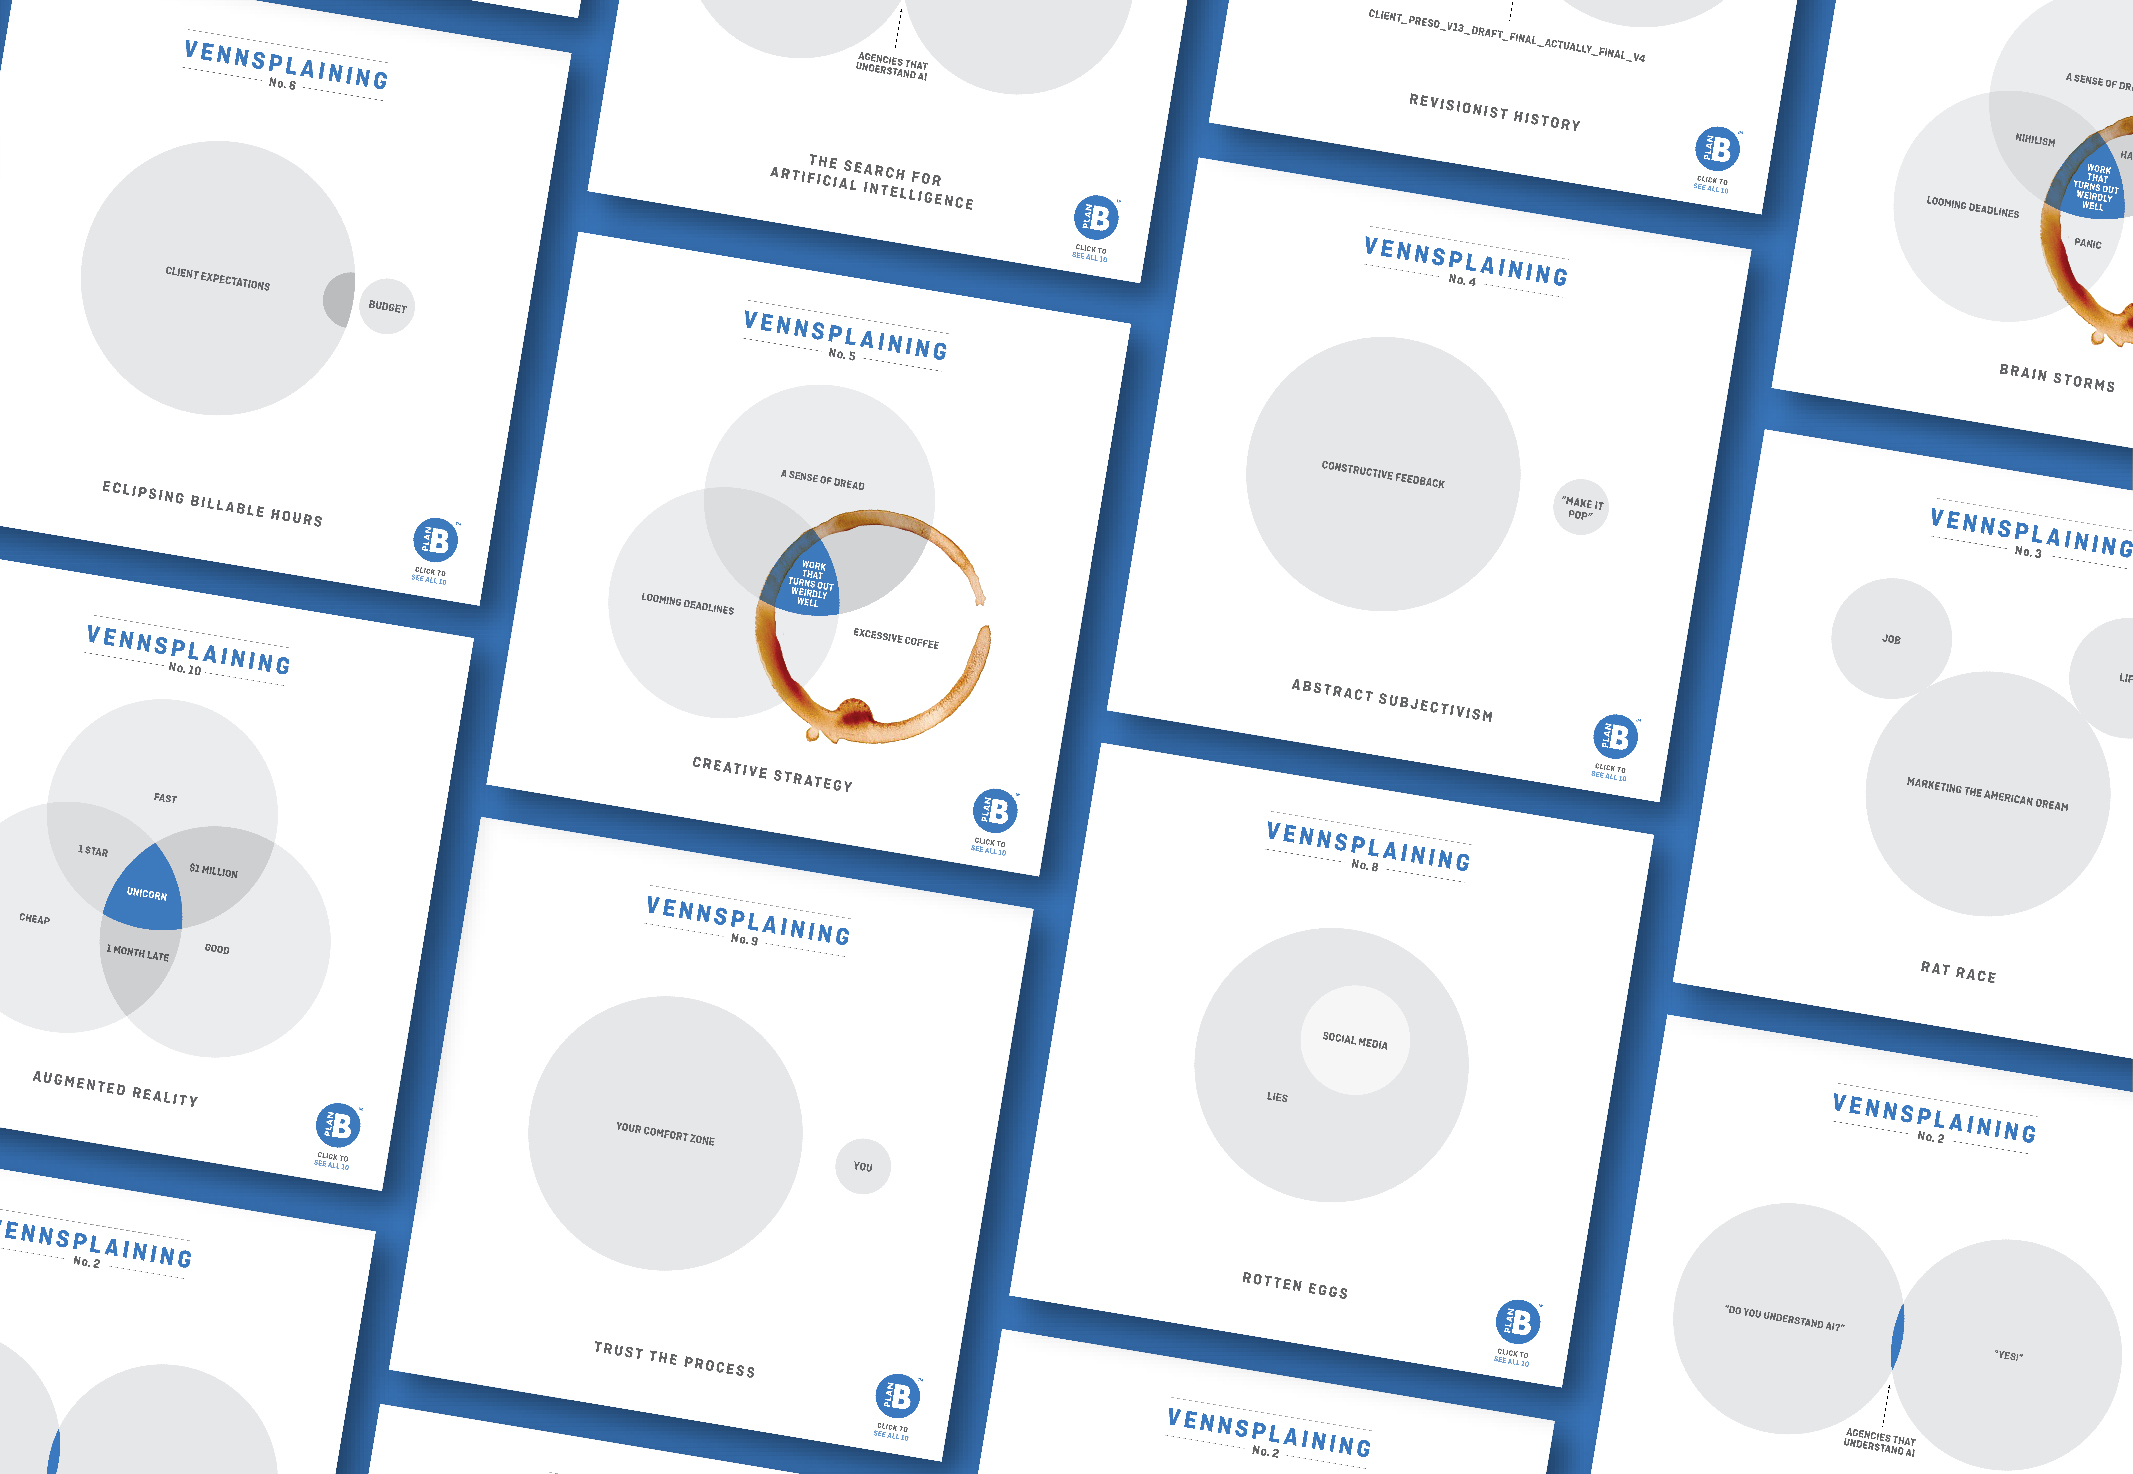
The creative team made the diagrams, but the Plan B account team would determine if they were more than inside jokes. Over a period of a month, the account team voted on diagrams they determined to be relatable. Whichever diagrams didn’t make the cut would be eliminated, and the creative team would make more diagrams to fill in the gaps. Rinse and repeat several times until we had narrowed the field down to 10 diagrams that satisfied our whole team.
But the Plan B team wanted to satisfy more than just ourselves.
The final step, deployment.
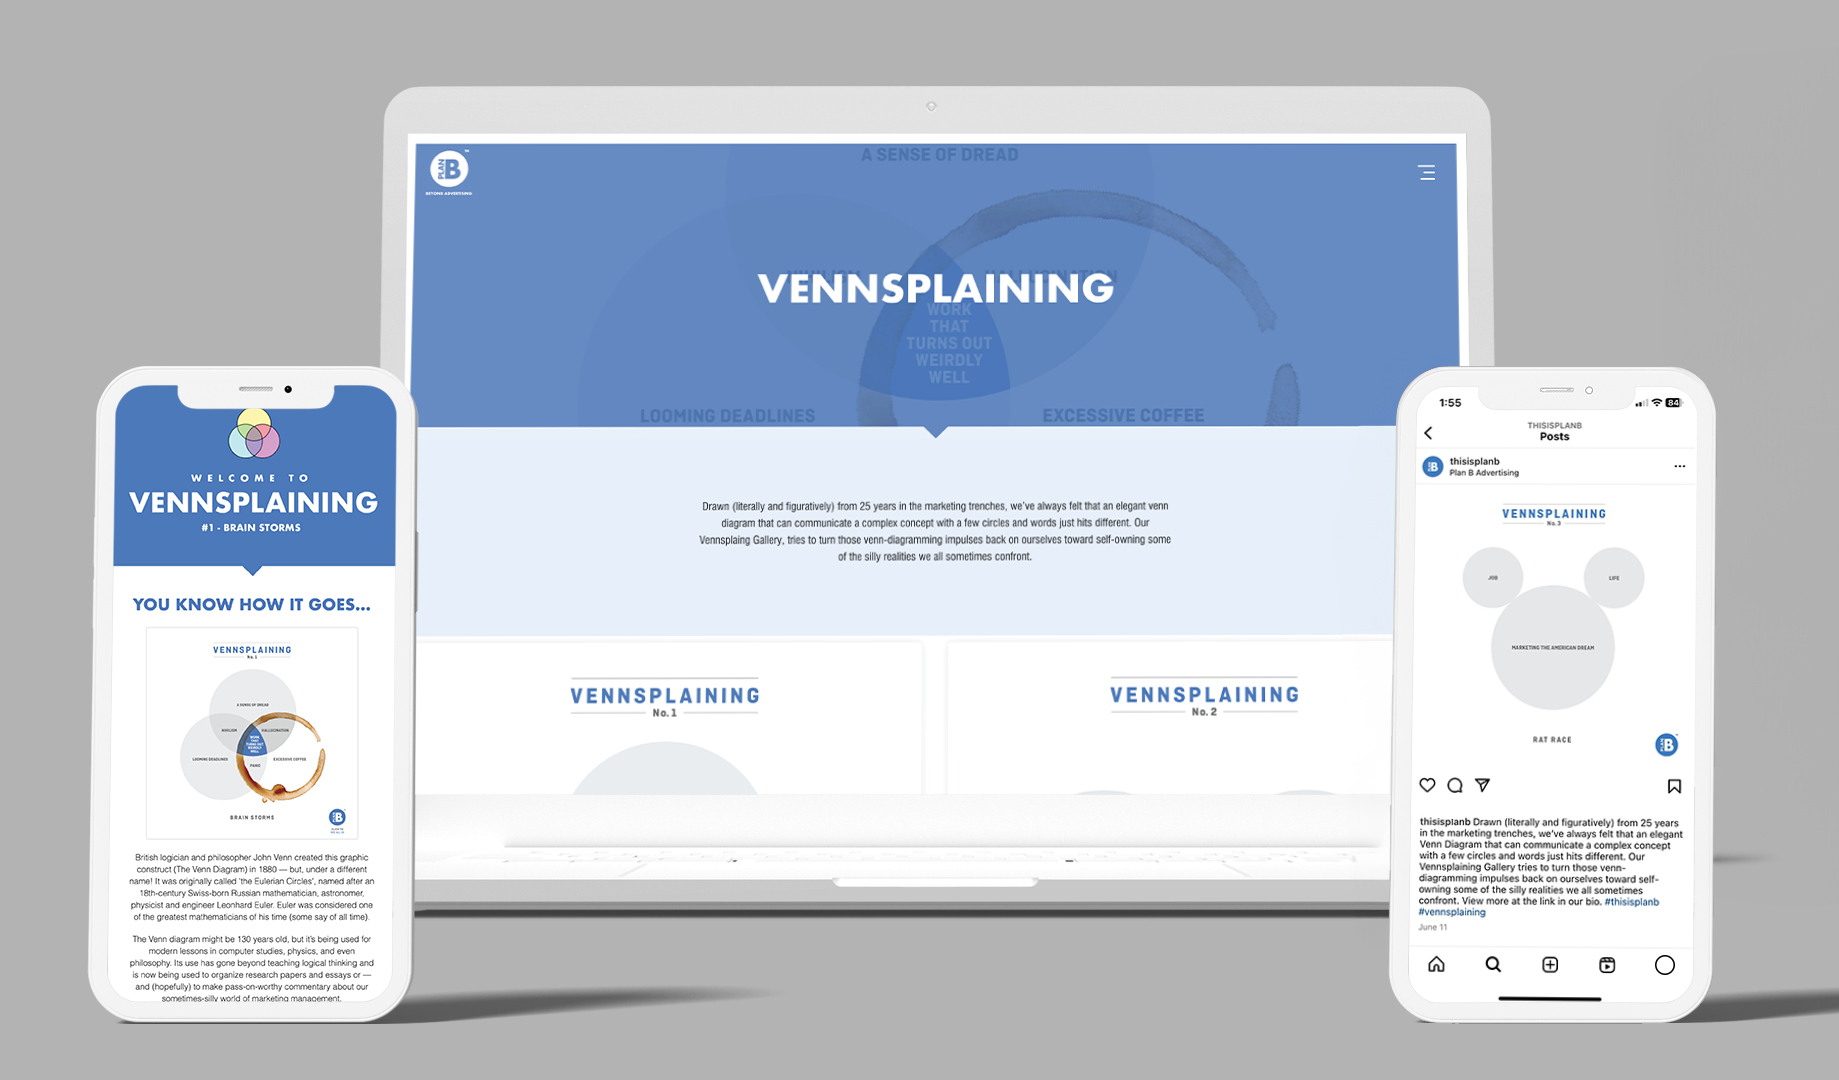
After determining the final 10 diagrams, the Plan B social and web team developed an online strategy that would get the Venn diagrams views and reactions. We created a landing page, an outgoing email campaign, a social media schedule, and even billboards so the Venn diagrams would create an immediate impact, while maintaining interest in the coming weeks.
The end result: a full-fledged internal campaign that stretched our entire team’s muscles to think outside Venn diagrams and look at our jobs in a new light.
Take a look at the end result here. And feel free to share any Venn diagrams you may think up below.